Costs of Public Administration
One main component of the GDP (Gross Domestic Product) is the "Final consumption expenditure of general government" which includes all expenditures for purchases of goods and services including the compensation of employees of the general government of a country. This is an important indicator to assess the costs of the public administration and provision of public services (without investments and social transfers).
These data is provided by Eurostat through the European System of Accounts (ESA) for the European Union and neighboring countries[1] in PPS (Purchase Power Standards) which allows a comparison of the costs of the public sector, taking into account the different purchasing power.

In 2021 the countries of the European Union(27) spent in average 7.142 PPS per inhabitant for the public administration and provision of public services. Albania is with 1.213 PPS the country with the lowest costs of public sector, Luxembourg with 15.487 PPS shows the highest costs per capita.
It clearly indicates the limited resources with which the public administrations in Southeast Europe are equipped.
Effectiveness of Public Administration
The Worldwide Governance Indicators (WGI) of the Worldbank measure the status quo of governance in nearly all countries of the world.
The indicators for "Government Effectiveness" give an insight into the perceptions of
- the quality of public services,
- the quality of the civil service,
- the degree of its independence from political pressures,
- the quality of policy formulation and implementation,
- and the credibility of the government's commitment to such policies.
The Government Effectiveness is a valuable indicator set for assessing the outcome of public administration. It ranges from -2.5 (weak) to 2.5 (strong) governance performance.

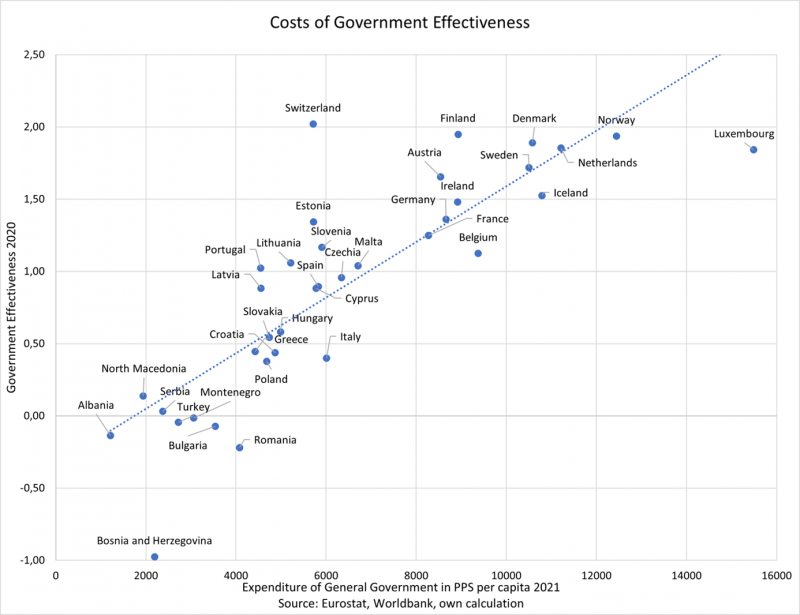
The spread within the European Union is very high with minus 0,22 in Romania and plus 1,95 in Finland. With plus 2,02 Switzerland takes the pole position in Europe while Bosnia and Herzegovina range on the last place with minus 0,98.
Cost of Government Effectiveness
A relevant question for Public Administration Reforms is: Is there a relation between cost and effectiveness and lead higher expenditures to better effectiveness.
Having on the one side
- the costs of public administration through the "Final consumption expenditure of general government" of the Gross Domestic Product and
- on the other side the outcome of the public administration through the Worldbank Effective Government indicators
allows to link these data and to provide an overview of the costs of government effectiveness.

The results clearly indicate a correlation of the costs of public administration and the government effectiveness. The higher the expenditures of the public administration (general government), the better the government effectiveness of the countries. Only Switzerland stands out here with low government expenditures and the highest effectiveness score at the same time.
For public administration reforms in Southeast European countries, the question arises as to how can high government effectiveness be achieved with low government expenditures for the public administration?

Relating the government effectiveness with the government expenditures in percentage of the GDP shows a different picture. No clear correlation between government effectiveness and the share of government expenditures in GDP can be recognized.
Nevertheless most of the Southeast European countries show significantly lower shares of GDP for government expenditures. While the average for the EU27 is 22,1 percent Western Balkan government expenditures average 16,3 percent of the GDP.
[1] UK and Kosovo data 2020/2021 are not available in Eurostat. Albania data from 2020


